


GRAPH DATA COURTESY THE REAL ESTATE REPORT, INC.
GRAPH DATA COURTESY THE REAL ESTATE REPORT, INC.
GRAPH DATA COURTESY THE REAL ESTATE REPORT, INC.
GRAPH DATA COURTESY THE REAL ESTATE REPORT, INC.
GRAPH DATA COURTESY THE REAL ESTATE REPORT, INC.
GRAPH DATA COURTESY THE REAL ESTATE REPORT, INC.
GRAPH DATA COURTESY THE REAL ESTATE REPORT, INC.
Fourth-quarter and year-end data compiled by The Real Estate Report Inc. indicates that the East End real estate market slowed in the fourth quarter, as well as the full year in 2011 compared to 2010 sales. The data include residential sales from all five East End towns: Riverhead, Southold, Shelter Island, Southampton and East Hampton.
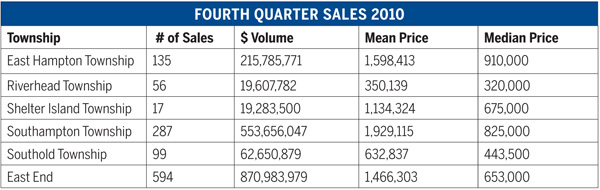
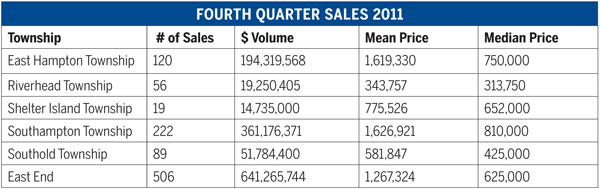
The quarterly data summarizes the state of the market based upon closings that took place between October 1 and December 31, 2011, compared with the same period in 2010.
In 2011, there were 506 deed transfers (sales) on the East End of Long Island in all five towns in the fourth quarter. There were a total of 594 transfers in fourth quarter 2010, a 14.8-percent reduction from 2010 to 2011.
The dollar volume was also down this past year—from nearly $871 million in 2010 fourth quarter to just over $641 million for the same period in 2011, a whopping 26.4-percent decrease.
The mean or average price calculation, which is a good indicator of high-end activity, fell 13.6 percent in the fourth quarter from 2010 ($1,466,303) to 2011 ($1,267,324).
The median price calculation, which measures the middle of the market and reflects low-end sales, fell slightly, 4.3 percent, from 2010 ($653,000) to 2011 ($625,000) in the fourth quarter.
The large reduction in volume in the fall of 2011 compared to the fall of 2010 was not unexpected. Last fall, there was a rush of sales, particularly in the luxury market, by buyers and sellers who expected the Bush tax cuts to expire and capital gains taxes to be increased at the end of the year, although the tax increases never materialized.
Taking the data from just East Hampton and Southampton towns, the total sales were down approximately $214 million from fourth quarter 2010 to fourth quarter 2011.
Total sales for fourth quarter 2010 were nearly $215 million for East Hampton (135 transfers) and close to $554 million for Southampton (287 transfers), totalling $769 million.
The total sales for fourth quarter 2011 were just over $194 million for East Hampton (120 transfers) and slightly above $361 million for Southampton (222 transfers), totalling approximately $555 million. The percentage decrease from 2010 fourth-quarter sales to 2011 fourth-quarter sales in East Hampton and Southampton towns added up to a fall-off of nearly 28 percent.
High-end activity remained stable in East Hampton for both fourth quarters. Mean prices for fourth-quarter 2010 in East Hampton were just under $1.6 million and slightly over $1.6 million in fourth quarter 2011.
Mean prices in Southampton dropped slightly from 2010 fourth quarter to 2011 fourth quarter. The mean price in fourth quarter 2010 was approximately $1.9 million, compared to approximately $1.6 million for the same quarter in 2011.
The median price in East Hampton took a hit from fourth quarter 2010 to the same period in 2011—from $910,000 to $750,000. The drop was less significant in Southampton, where the median price in fourth quarter 2010 was $825,000, and $810,000 in fourth quarter 2011.
The reduction in volume over the five towns probably was inevitable, given the artificial demand created by last year’s tax concerns. And the median and mean price calculations often tell us more about whether activity is concentrated on the high end or low end, rather than the real direction of prices. But with across-the-board declines in volume, dollar volume and both price calculations, the obvious conclusion is that the market this fall, overall, was significantly weaker than last fall.
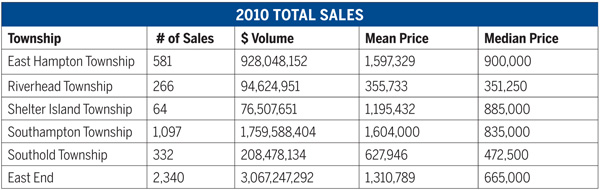
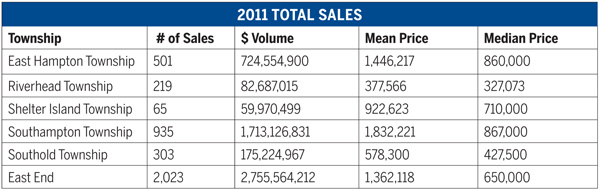
There were 2,023 deed transfers in the five East End towns in 2011. These 2,023 sales are a 13.5-percent reduction in volume compared to sales in 2010, which totalled 2,340.
As a result of the reduction in volume, total dollars spent on real estate declined by about 10 percent—from almost $3.1 billion in 2010 to about $2.8 billion in 2011.
With nearly 14 percent less activity throughout the year, one would expect that prices would decline as unsold inventory piled up and sellers were forced to cut their prices to compete with each other. Surprisingly, both the mean and median price calculations were extremely stable for the five towns (mean was approximately $1.3 million in both years, and median was $655,000 in 2010, compared to $650,000 in 2011) and ended 2011 virtually unchanged from 2010 levels.
Inventory may be shrinking roughly in line with volume, keeping supply, demand and prices stable.
The pricing data in East Hampton and Southampton towns in the fourth quarter of 2011 looked remarkably similar. Each town had mean prices, which are luxury indicators, at around $1.6 million, and median prices, which are low-end indicators, at around half the mean, or $800,000.
But a closer look at the yearly data, which tends to smooth out quarterly anomalies, shows that while prices were at the same levels for Southampton and East Hampton in the fall of 2011, they may be headed in different directions.
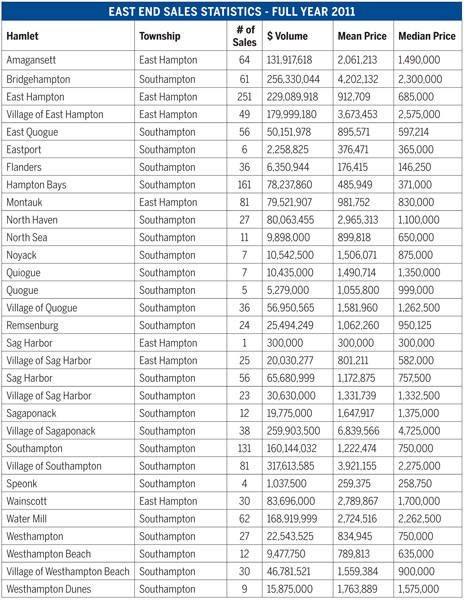
In 2010 and 2011, both East Hampton and Southampton had similar median prices, roughly between $835,000 and $900,000. For both towns, then, roughly half the sales were below around $850,000 and roughly half the sales were above that number.
In 2010, both towns had similar mean prices, at around approximately $1.6 million, showing that high-end sales were about the same as well. But in 2011, the luxury market skyrocketed in Southampton, with the mean rising by 15.6 percent, to approximately $1.85 million. At the same time, the luxury market fell in East Hampton, dropping the mean by 10 percent to $1.44 million.
The total dollar volume figures illustrate East Hampton’s weakness among luxury buyers in 2011, compared to the stability of Southampton during the same period.
In 2010 and 2011, the total dollars spent on homes in Southampton was very stable, with just over $1.75 billion spent in 2010 (1,084 transfers) and slightly more than $1.7 billion in 2011 (925 transfers). But in East Hampton, the money flow dropped dramatically, from approximately $928 million in 2010 (581 transfers) to approximately $725 million in 2011 (503 transfers), a reduction of about 22 percent in dollars.
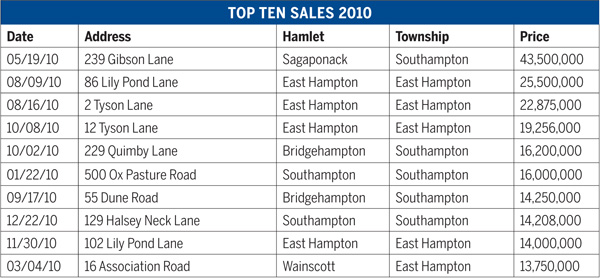
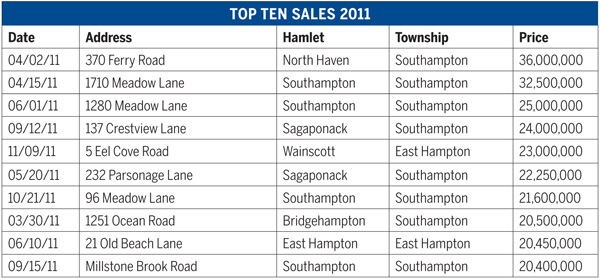
A big driver of this disparity in luxury prices and money flow are the highest sales of the year. In 2010, East Hampton and Southampton each had half of the top 10 sales for all five of the East End towns. In 2011, only two were in East Hampton, with the remaining eight in Southampton.
Not only are more high-end sales taking place in Southampton, the influence of these sales is becoming increasingly outsized, as luxury prices continue to rise.
In 2010, three of the top 10 sales were priced over $20 million, with the lowest sale under $14 million. In 2011, all of the top 10 sales were priced over $20 million.


 27east on Feb 6, 2012